Electric meter (traditional meter or electric submeter) usage data can be available in increments ranging from real-time to monthly. Accurate energy usage reports and access to data allows tenants and building managers to make informed decisions about energy use. They enable managers to identify actionable energy efficiency measures to save costs.
Utility usage data reports enable energy managers to take different views to comprehend a building’s energy use - A low-resolution view (daily or monthly totals) tracks improvements over long periods and higher-level trends. On the other hand, a high-resolution view (detailed data readings) allows for the detection of immediate problems and changes throughout the day.
Let’s take a look at all the essential reports you need to manage utility consumption in your building.
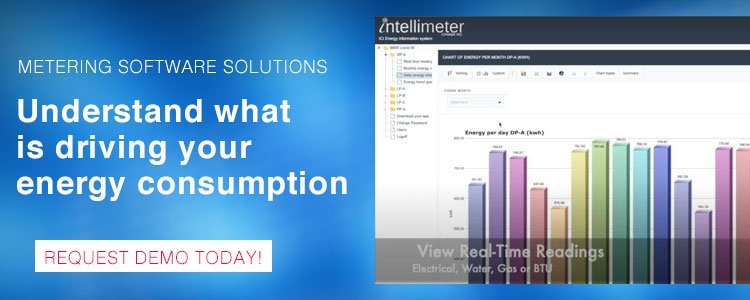
Daily Utility Use over a Month
These reports should be checked monthly to track overall change from the same month the previous year. Monthly comparison whether progress is being made towards long-term sustainability goals. Installing a submeter where it’s required will make the data collection job much easier and more accurate.
Daily Electricity Load in High-Resolution
Checking this report daily will detect any spikes and outliers from the typical pattern. Is it lower or higher? What is the reason behind the change? Submetering technology provides real-time and granular visibility of utility consumption that can be used for making informed and actionable decisions.
Overall Utilities Building Breakdown
This report breaks down information that contribute to a building’s energy use. It allows you to see how each utility contributes to a building’s overall energy use and determine opportunities to save. Is electricity the biggest driver of consumption? Or heating? Weekly checking of this report is recommended.
Buildings Portfolio Comparison
A building’s portfolio comparison measures performance across all buildings and various time increments (daily, monthly, and annually). Submetering records accurate energy consumption data, and divides utility consumption by occupancy or building area (for the most precise comparison).
Targeted Systems (High Resolution)
Targeted systems report gives a high-resolution chart of specific high-cost, mission-critical systems that need to be monitored. These reports identify usage during times when equipment shouldn’t be used, spikes and anomalies, and overall increase/decrease when compared to historical use. To get real-time consumption data, install a submeter to each piece of equipment you wish to track.
System vs. Outdoor Temperature
The report shows the correlation between the outdoor and system temperature, to help explain any spikes in the use of HVAC or other weather-dependent systems.
Weather Normalized Energy Use
Weather Normalized Energy Use shows the weather-normalized total energy use in a month compared to the previous year. It shows what utility consumption would have been under typical weather conditions (removing the factors of an abnormally hot summer or super-cold winter).
Energy use data obtained from these reports are valuable for tracking the energy consumption behavior of individual tenants, individual pieces of equipment in industrial buildings, and overall building consumption on a daily, monthly, and yearly basis. Submetering your buildings is crucial for managing utility consumption and improving its energy efficiency.